Analytics
Our Push Panel comes with a simple analytics chart for you to evaluate your push message result and effectiveness. It is a simple pie chart with a few key indicators. The analytics chart will only be available upon completion of sending that specific push.
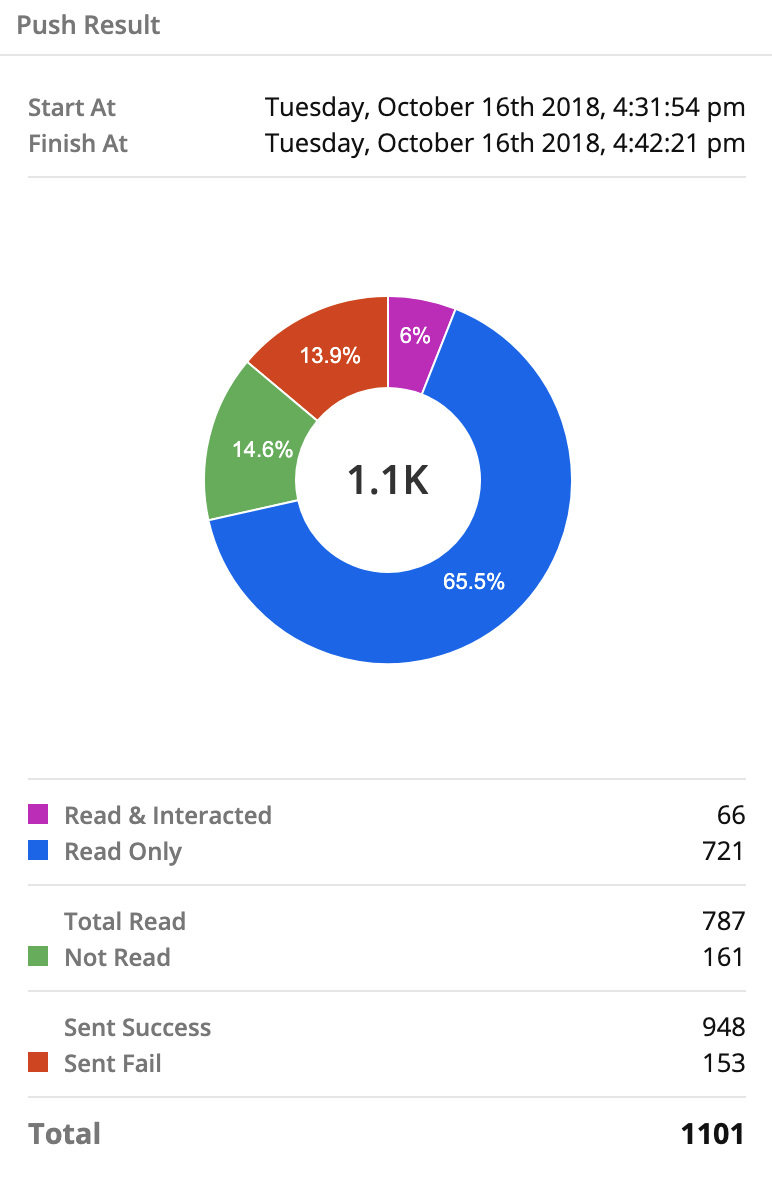
Push Result
Start At & Finish At
| Property | Description |
|---|---|
| Start At | The scheduled start time of your push |
| Finish At | The end time upon completion of sending out the push |
Please note that it may take up to an hour for sending push message to a massive audience group. The current system frequency is 100 messages per minute. It is advised to divide your audiences into batches or simply schedule an earlier push time.
Key Indicators
| Property | Description |
|---|---|
| Read & Interacted | Subscribers who have read the message and performed response actions such as sending a message reply or clicking a button |
| Read Only | Subscribers who have only read your push message |
| Not Read | Subscribers who have received the push message but didn't open it |
| Sent Success | Subscribers who have receive the push message |
| Sent Fail | Subscribers who fail to receive the push message because of various reasons, such as connection problem or they have blocked your chatbot |
These numbers will be presented in % in the pie chart above.